28–3: SUPER BOWL LI AS A WIN-PROBABILITY CHART
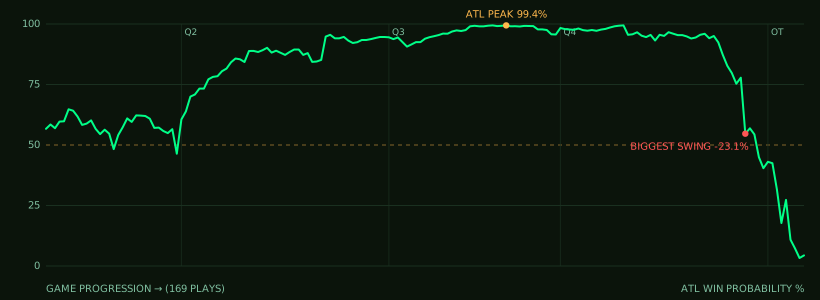
Everybody knows the number. Almost nobody has seen the shape of it. Here is Atlanta's collapse plotted play by play — the plateau at the top of the mountain, and the cliff on the other side.
[ OPEN THIS GAME IN DRIVE_TRACKER → ]
THE PEAK, AND THE CLIFF
At its highest point, our win-probability model gave Atlanta a 99.4% chance of winning Super Bowl LI — in the third quarter, with just under 20 minutes left in the game, the Falcons still up 28–3 on Tevin Coleman's earlier touchdown. The number is not a typo and it is not hindsight. It is what the math said at the time, given the score, the time remaining, and the field position. New England's win probability bottomed out at 0.6%. Six teams in a thousand.
What the chart shows that the memory blurs is the plateau. This was not a lead that evaporated in one bad snap. Atlanta sat above 95% for the better part of a quarter and a half. There was time. There were possessions. The collapse needed all of them — which is exactly why it still doesn't feel real. A fumble you can explain. A ninety-minute slide from near-certain champion to overtime loser is harder to file away.
It's worth sitting with what 99.4% actually means, because the number gets thrown around like a verdict. It is not a guarantee; it is a frequency. If you could replay this exact situation — 25-point lead, that much clock, that field position — a thousand times, the team in Atlanta's shoes wins about 994 of them. This was one of the six. That is the honest reading, and it is also why "the model was wrong" misses the point. The model wasn't wrong. Atlanta was that far ahead. The rare thing simply happened, on the biggest stage there is, to the team that could least afford it.
HOW ATLANTA BUILT A 25-POINT LEAD
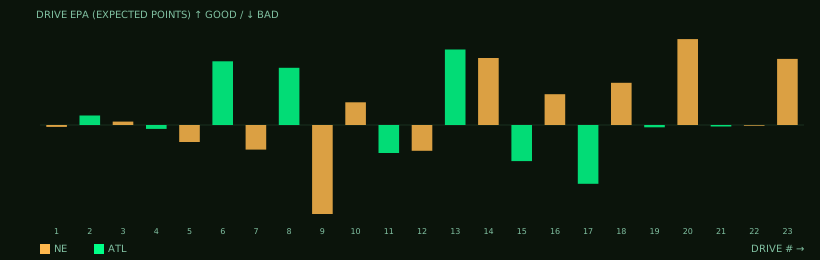
For a half and change, Atlanta earned every point. The expected points bars aren't close: the Falcons turned drives into touchdowns while New England turned drives into punts and, once, into a pick-six going the other way. Robert Alford's 82-yard interception return is the tall red bar — a single New England possession worth −8.2 EPA, because it didn't just end a drive, it handed Atlanta seven points. By the time Coleman scored to make it 28–3, the Falcons had out-gained, out-schemed, and out-EPA'd the greatest quarterback-coach pairing of the era for forty minutes.

THE PLAY THE MODEL NEVER FORGAVE
Comebacks have a hinge. On the win-probability chart, Atlanta's line holds near the top until one possession breaks its back: drive 18. Up 28–12 late in the fourth, with the ball and a chance to bleed the clock or add points, Matt Ryan was strip-sacked by Dont'a Hightower. Atlanta's offense generated −5.4 EPA on that possession — the worst drive of their night — and gave New England the ball in scoring range. The Patriots scored, converted the two-pointer, and the arithmetic that had felt academic all evening suddenly had a pulse.
From there the chart does the thing that makes people who watched it live go quiet. New England's final regulation touchdown drive tied it at 28 and swung Atlanta's win probability by roughly 34 points on a single drive. Then the overtime coin toss, the drive nobody in Atlanta got to answer, and James White's two-yard run: a +6.1 EPA possession that ended it. Falcons' win probability, final: near zero. The mountain, and then the sea.
WHAT THE NUMBERS SAY vs WHAT THE STORY SAYS
THE DRIVE LOG
Every drive, in order, with the possessing team's expected points added and its net win-probability shift. This is the raw material behind the charts above — and behind every number in this article. All of it is computed from the same play-by-play; none of it is from memory.
| # | TEAM | RESULT | DRIVE EPA | WP SHIFT |
|---|---|---|---|---|
| 1 | NE | PUNT | -0.17 | -3.1% |
| 2 | ATL | PUNT | +0.87 | -1.0% |
| 3 | NE | PUNT | +0.31 | -0.7% |
| 4 | ATL | PUNT | -0.36 | -2.3% |
| 5 | NE | TO | -1.56 | -3.4% |
| 6 | ATL | TD | +5.92 | +15.4% |
| 7 | NE | PUNT | -2.26 | -4.4% |
| 8 | ATL | TD | +5.29 | +7.3% |
| 9 | NE | DEF TD | -8.24 | -6.1% |
| 10 | NE | FG | +2.08 | -0.4% |
| 11 | ATL | END | -0.03 | -0.6% |
| 12 | ATL | PUNT | -2.57 | -3.8% |
| 13 | NE | PUNT | -2.37 | -3.9% |
| 14 | ATL | TD | +7.00 | +4.5% |
| 15 | NE | TD | +5.22 | -0.0% |
| 16 | ATL | PUNT | -3.31 | -0.8% |
| 17 | NE | FG | +2.83 | -0.7% |
| 18 | ATL | TO | -5.40 | -3.5% |
| 19 | NE | TD | +3.87 | +0.8% |
| 20 | ATL | PUNT | -0.21 | +1.3% |
| 21 | NE | TD | +7.89 | +33.9% |
| 22 | ATL | PUNT | -0.17 | -14.2% |
| 23 | NE | END | -0.06 | -2.6% |
| 24 | NE | TD | +6.07 | +43.0% |