THE 28–3 NOBODY REMEMBERS: MINNESOTA'S 4TH-AND-25 SEASON
Everyone can draw the Falcons' collapse from memory. Here's one with the same shape and none of the fame: a 9–6 Vikings team, a 3-win Arizona club, 96.9% win probability, and a season that ended on the last snap of the year.
[ OPEN THIS GAME IN DRIVE_TRACKER → ]
A GAME THAT DECIDED A SEASON
On paper this was garbage time for a whole franchise. Arizona came in at 3–12, eliminated, playing out the string in a mostly empty stadium. Minnesota came in at 9–6, needing a win to stay in front of Green Bay in the NFC North. The Vikings had led the division for most of the season. Win this and they are 10–6 with the tiebreaker edge — a better conference record than the Packers, 8–4 to 8–6 — and they are hosting a playoff game. Lose, and the math turns cruel: 9–7, and Green Bay's 10–6 takes the North. There was no wild-card safety net. This was the whole season, against a team with nothing to play for.
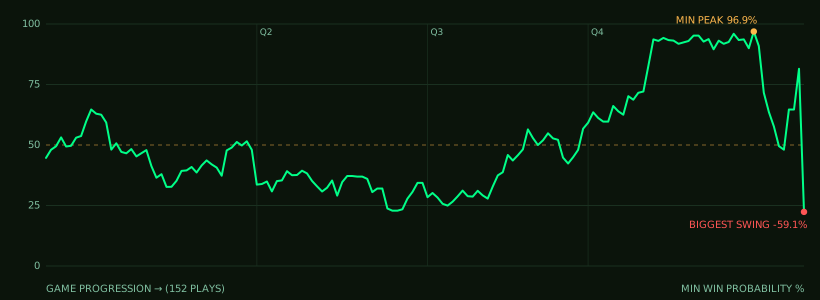
For fifty-eight minutes, Minnesota did enough. They led 17–6. The win-probability line spent the fourth quarter climbing toward certainty. Then a 3–12 team playing out a lost season put together the only two drives it needed all year.
Pull up the Drive Tracker line and the shape is almost comic in its calm. For three quarters this is a coin flip between two teams that can't get out of their own way — the win-probability line wanders around 50% like it can't find the exit. Then Minnesota scores twice in the middle of the fourth, the line climbs into the 90s, and everything looks decided. What the chart can't show you is the thing that made it matter: a scoreboard in one city and a standings page in another, both waiting on this game between a contender and a corpse.
THE BETTER TEAM LOST (AND WASN'T EVEN GOOD)
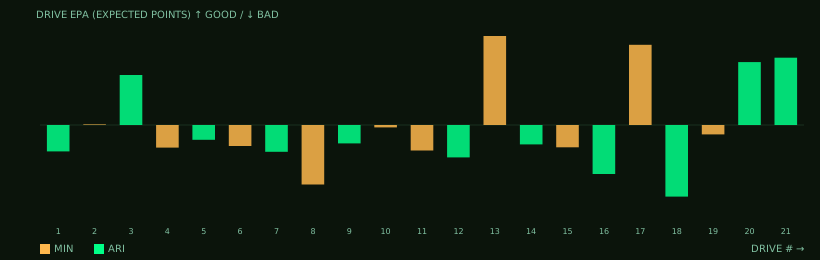
This is the honest part the highlight would skip: nobody played well. Minnesota's offense generated barely positive expected points for the day. Arizona's was flatly negative — a genuinely bad offense having a genuinely bad day, right up until it wasn't. The Vikings didn't blow a lead because they collapsed statistically. They blew it because in a game between two mediocre teams, the mediocre team with nothing to lose made the two plays that a season turned on, and the mediocre team with everything to lose made none.

FOURTH AND TWENTY-FIVE
Down 17–12 in the final minute, Arizona faced fourth-and-25 from the Minnesota 28. Our model had given the Vikings a 96.9% chance to win earlier in the quarter — but a shaky stretch since then had already pulled that number down to about 81% by the time Arizona lined up for this snap. Still comfortably the favorite. A stop — any stop, a batted ball, a checkdown, an incompletion — ends the season the right way. Instead Josh McCown escaped pressure and found Nathan Poole in the corner of the end zone as time expired. Touchdown. Final: 18–17.
Minnesota finished 9–7 and stayed home. Green Bay finished 10–6 and won the division that had been Minnesota's to keep. Arizona finished 4–12, and this was one of their four wins — a throwaway result for them, a season-ending guillotine for someone else.
WHAT THE NUMBERS SAY vs WHAT THE STORY SAYS
THE DRIVE LOG
Every drive, in order, with the possessing team's expected points added and its net win-probability shift. Watch drive 21 — Arizona's game-winner — carry a +71.6% swing. Every figure here is computed from the play-by-play, not remembered.
| # | TEAM | RESULT | DRIVE EPA | WP SHIFT |
|---|---|---|---|---|
| 1 | ARI | PUNT | -1.83 | -4.7% |
| 2 | MIN | DOWNS | +0.04 | -1.3% |
| 3 | ARI | FG | +3.47 | +8.6% |
| 4 | MIN | MISS | -1.57 | -5.9% |
| 5 | ARI | PUNT | -1.03 | -3.9% |
| 6 | MIN | PUNT | -1.46 | -6.8% |
| 7 | ARI | PUNT | -1.86 | -5.2% |
| 8 | MIN | TO | -4.13 | -12.2% |
| 9 | ARI | FG | -1.28 | -5.7% |
| 10 | MIN | TO | -0.17 | -3.1% |
| 11 | MIN | PUNT | -1.77 | -3.5% |
| 12 | ARI | PUNT | -2.25 | -3.9% |
| 13 | MIN | TD | +6.19 | +17.6% |
| 14 | ARI | PUNT | -1.35 | -9.3% |
| 15 | MIN | PUNT | -1.55 | -10.5% |
| 16 | ARI | PUNT | -3.40 | -16.8% |
| 17 | MIN | TD | +5.58 | +26.2% |
| 18 | ARI | TO | -4.97 | -10.9% |
| 19 | MIN | FG | -0.65 | +0.2% |
| 20 | ARI | TD | +4.37 | -1.5% |
| 21 | ARI | TD | +4.67 | +71.6% |